As homes built during the housing bubble show signs of aging, the need for repairs and upgrades should drive demand for products and services from these five companies.
Keep in mind that new home construction peaked in mid-2006 when more than 1.8 million single-family homes were built.
These companies will also benefit when and if Congress passes a bill to begin Infrastructure Spending projects which was a pledge offered by President Trump during his election campaign.
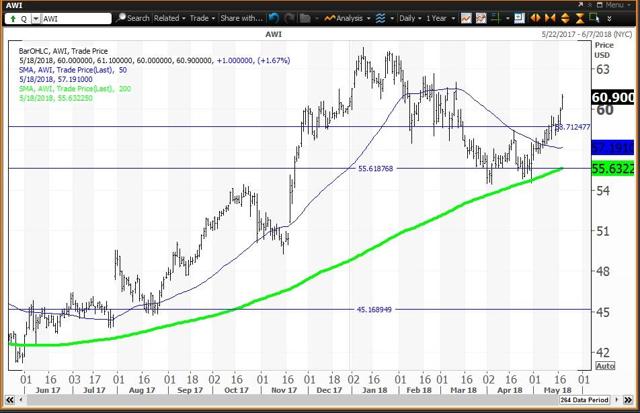
Armstrong World Industries, Inc. (NYSE:AWI) provides ceilings and cabinets for both the home and infrastructure buildings. The stock is in recovery mode after holding its 200-day simple moving average of $54.76 on April 30. It now has a positive weekly chart.
Lennox International, Inc. (NYSE:LII) provides air conditioning and heating systems for the home and infrastructure buildings. The stock is recovering from a correction and now has a positive weekly chart.
Masco Corp. (NYSE:MAS) provides home improvement and building products for the home repairs and planned structures. The stock is a laggard in correction territory below a "death cross" with a neutral weekly chart.
Owens Corning (NYSE:OC) makes insulation, roofing and siding products for home improvement and construction projects. The stock is a laggard in bear market territory below a "death cross" with a negative but oversold weekly chart.
Vulcan Materials Co. (NYSE:VMC) provides asphalt mix and concrete, which are needed to build homes and to "build the wall". The stock has had a strong recovery from bear market territory and has a positive weekly chart.
A Scorecard For Five Home Repair, Infrastructure Stocks
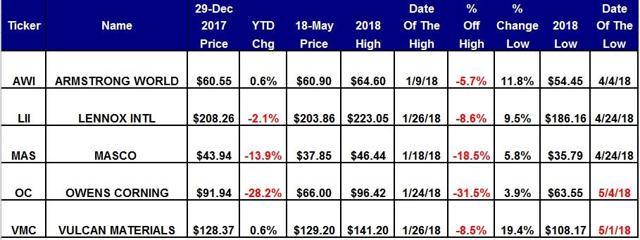
Courtesy of MetaStock Xenith
The daily chart for Armstrong World shows that the stock held its 200-day simple moving average of $54.76 on April 30 and that buying weakness to my quarterly value level of $55.57 was a winning strategy, and the stock is now above my annual pivot of $58.71, which has been a magnet since Feb. 8.
Investors should buy weakness to my annual and semiannual pivots of $58.71 and $55.57, respectively, and reduce holdings on strength to my monthly risky level of $66.76.
Lennox International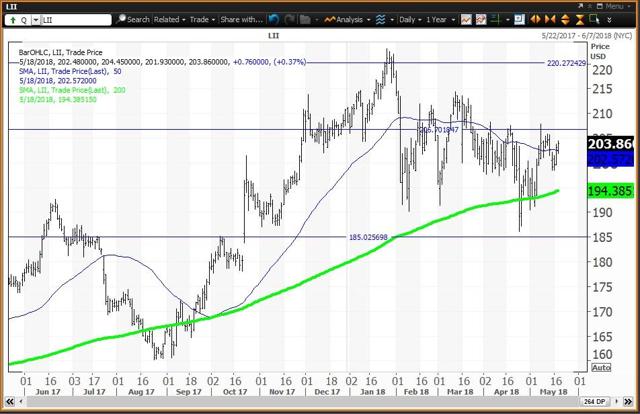
Courtesy of MetaStock Xenith
The daily chart for Lennox shows that the stock has stayed above my annual value level of $185.02 all year long. My semiannual pivot of $206.75 has been a magnet since Jan. 2. A breakout above $206.75 targets my quarterly risky level of $220.30.
Investors should buy weakness to my annual value level of $185.02 and reduce holdings on strength to my quarterly risky level of $220.30.
Masco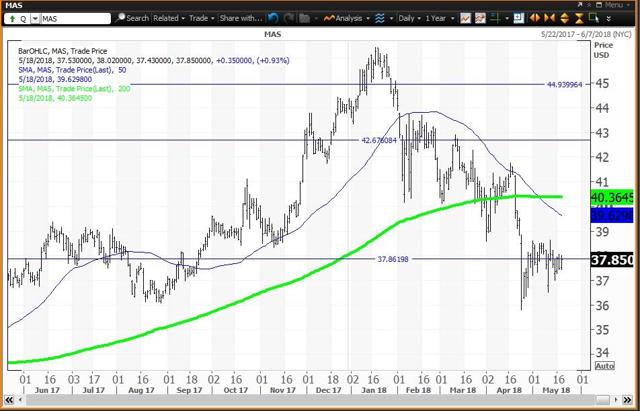
Courtesy of MetaStock Xenith
The daily chart for Masco shows that the stock has been below a "death cross" since May 4 when the 50-day simple moving average at $39.63 fell below the 200-day simple moving average at $40.36 indicating that lower prices lie ahead. However, my annual pivot of $37.85 has been a magnet since April 24.
Investors should buy weakness to the 200-week simple moving average at $31.00, which is also the "reversion to the mean" and reduce holdings on strength to my quarterly, semiannual and monthly risky levels at $42.53, $42.67 and $44.93, respectively.
Owens Corning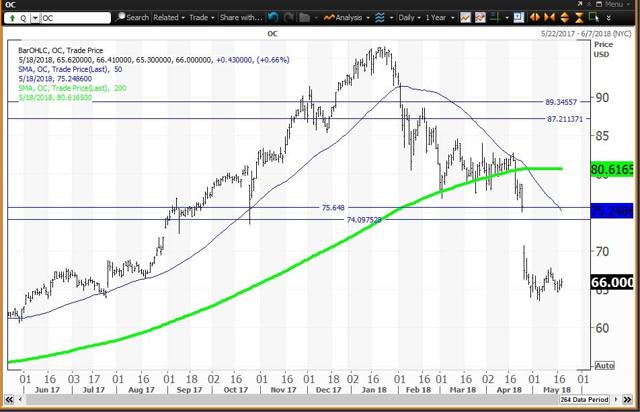
Courtesy of MetaStock Xenith
The daily chart for Owens Corning shows that the stock has been below a "death cross" April 27 when the 50-day simple moving average at $75.25 fell below the 200-day simple moving average at $80.62, indicating that lower prices lie ahead. The stock is well below my annual and semiannual pivots at $75.66 and $74.09, respectively.
Investors should buy weakness to the 200-week simple moving average of $54.29, which is also the "reversion to the mean" and reduce holdings on strength to my semiannual and annual pivots at $74.09 and $75.66, respectively.
Vulcan Materials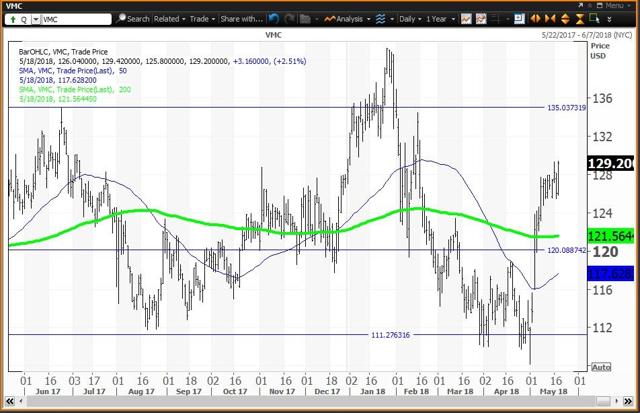
Courtesy of MetaStock Xenith
The daily chart for Vulcan Materials shows that the stock stabilized around my annual pivot of $111.28 which was a magnet between March 28 and May 1. The stock then catapulted higher above my monthly pivot at $120.08. The upside is to my quarterly risky level of $135.03.
Investors should buy weakness to my monthly pivot of $120.08 and my annual value level of $111.28 and reduce holdings on strength to my quarterly risky level of $135.03.
Disclosure: I/we have no positions in any stocks mentioned, and no plans to initiate any positions within the next 72 hours.
I wrote this article myself, and it expresses my own opinions. I am not receiving compensation for it (other than from Seeking Alpha). I have no business relationship with any company whose stock is mentioned in this article.
No comments:
Post a Comment